Dow Jones Chart Analysis | With Our Investing Chart Set-up

Dow Chart Analysis

Dow jones Chart analysis with the help of investing charts

Dow Daily Chart Analysis

Dow Jones chart Analysis.

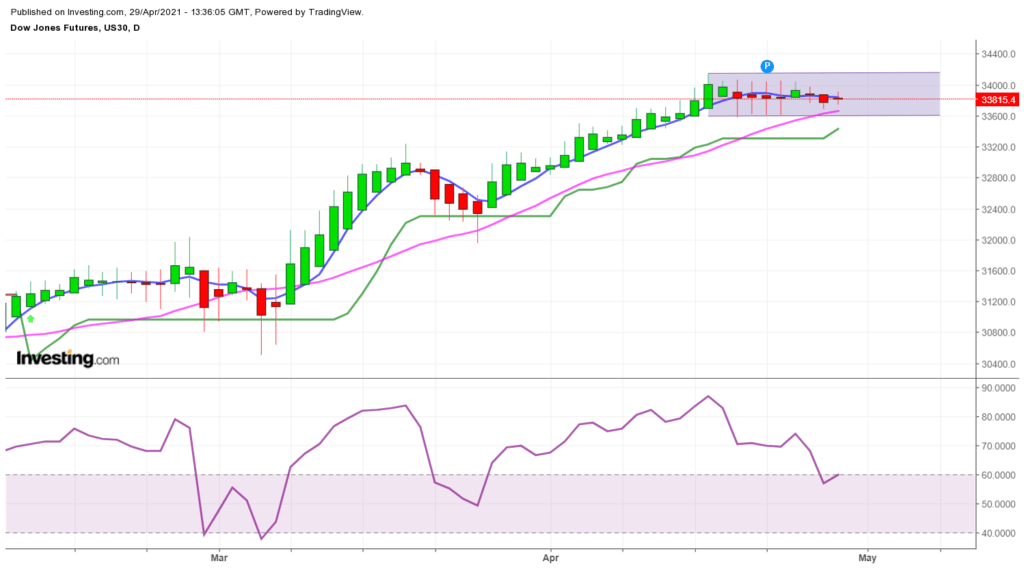
As we see in our daily chart, we got a buy signal near 31200 and from 31200 Dow jones runs above 34000 and now trading in a range of 33600 to 34200. 

On a closing basis If it breaks 33600 and closes 2 days below 33600 then it may fall to the 33333, 32900  and then 32300 level, So be cautious as we also see RSI divergence in our chart.

Moving Average Simple

  • MA5  33871.28 Buy
  • MA10  33878.65 Buy
  • MA20  33924.65 Buy
  • MA50  33973.86 Sell
  • MA100  33940.44 Buy
  • MA200  33563.21 Buy

Pivot Points

Classic

33815.18

33819.26

33821.30

33825.38

33827.42

33831.50

33833.54

Fibonacci

33819.26

33821.60

33823.04

33825.38

33827.72

33829.16

33831.50

Camarilla

33821.66

33822.22

33822.78

33825.38

33823.90

33824.46

33825.02

Woodie’s

33814.16

33818.75

33820.28

33824.87

33826.40

33830.99

33832.52

dow jones chart analysis 15min

Dow 15 Min Chart Analysis

Dow Jones chart Analysis.

Todays (29/04/2021), As we see in our 15 Min chart, Dow Jones create a sell signal near 33850  and it come down to 33770 level.

Dow jones chart analysis, dow 5 min chart

Dow 5 Min Chart Analysis

Dow Jones chart Analysis.

Todays (29/04/2021), As we see in our 5 Min chart, Dow Jones create a sell signal near 33870  and it comes down to 33725 level.

Conclusion

Be cautious in all Global markets even also in our Indian market.

Other Articles
Disclaimer : 

Blog Provides Views and Opinion as Educational Purpose Only, We are not responsible for any of your Profit / Loss with this blog Suggestions. The Owner of this blog is not SEBI registered, consult your Financial Advisor before taking any Position.

Leave a Reply

Your email address will not be published. Required fields are marked *