
Bandhan Bank Option Strategy | Bandhan Bank Target
Bandhan Bank Option Strategy
Daily chart
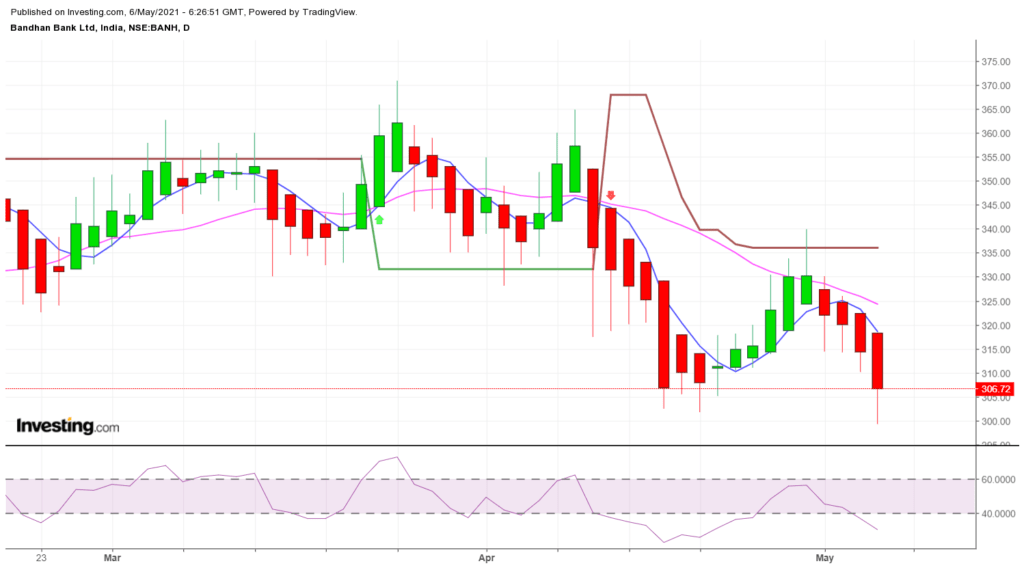
For Bandhan Bank option strategy first we check charts.
As we see in our daily chart Bandhan Bank generates a sell signal near 335 and then continue its fall and come down to 300 level
Intraday chart
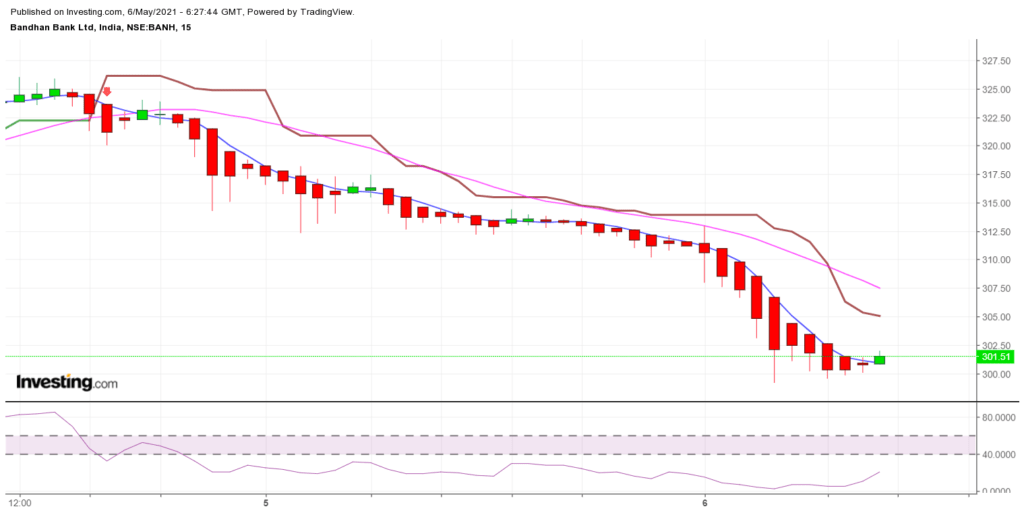
Strategy Bandhan Bank
Bandhan Bank Option Strategy, AS we see in our chart that Bandhan Bank generate sell signal , Now which strategy is low risk and good reward for me. we create bear put spread for better return as our view that Bandhan bank may fall below 270 level.
First we Buy 280 Put at CMP 6.5
Short 270 Put at CMP 4.25
Bandhan Bank Payoff Chart
| No | Strike | Premium | Option | Buy(1)Sell(0) | Expiry | Gross P/L | LOT SIZE | TOTAL P /L |
| 1 | 280 | 6.5 | put | 1 | 310 | -2 | 1800 | -4050 |
| 2 | 270 | 4.25 | put | 0 | 308 | -2 | 1800 | -4050 |
| 3 | 306 | -2 | 1800 | -4050 | ||||
| 4 | 304 | -2 | 1800 | -4050 | ||||
| 5 | 302 | -2 | 1800 | -4050 | ||||
| 6 | 300 | -2 | 1800 | -4050 | ||||
| 7 | 298 | -2 | 1800 | -4050 | ||||
| 8 | 296 | -2 | 1800 | -4050 | ||||
| 9 | 294 | -2 | 1800 | -4050 | ||||
| 292 | -2 | 1800 | -4050 | |||||
| Difference | 2 | 290 | -2 | 1800 | -4050 | |||
| Expiry from | 310 | 288 | -2 | 1800 | -4050 | |||
| lot size | 1800 | 286 | -2 | 1800 | -4050 | |||
| 284 | -2 | 1800 | -4050 | |||||
| 282 | -2 | 1800 | -4050 | |||||
| 280 | -2 | 1800 | -4050 | |||||
| 278 | -0 | 1800 | -450 | |||||
| 276 | 2 | 1800 | 3150 | |||||
| 274 | 4 | 1800 | 6750 | |||||
| 272 | 6 | 1800 | 10350 | |||||
| 270 | 8 | 1800 | 13950 | |||||
| 268 | 8 | 1800 | 13950 | |||||
| 266 | 8 | 1800 | 13950 | |||||
| 264 | 8 | 1800 | 13950 | |||||
| 262 | 8 | 1800 | 13950 | |||||
| 260 | 8 | 1800 | 13950 | |||||
| 258 | 8 | 1800 | 13950 | |||||
| 256 | 8 | 1800 | 13950 | |||||
| 254 | 8 | 1800 | 13950 | |||||
| 252 | 8 | 1800 | 13950 | |||||
| 250 | 8 | 1800 | 13950 | |||||
| 248 | 8 | 1800 | 13950 | |||||
| 246 | 8 | 1800 | 13950 | |||||
| 244 | 8 | 1800 | 13950 | |||||
| 242 | 8 | 1800 | 13950 | |||||
| 240 | 8 | 1800 | 13950 | |||||
| 238 | 8 | 1800 | 13950 | |||||
| 236 | 8 | 1800 | 13950 | |||||
| 234 | 8 | 1800 | 13950 | |||||
| 232 | 8 | 1800 | 13950 | |||||
| 230 | 8 | 1800 | 13950 | |||||
| 228 | 8 | 1800 | 13950 | |||||
| 226 | 8 | 1800 | 13950 | |||||
| 224 | 8 | 1800 | 13950 | |||||
| 222 | 8 | 1800 | 13950 | |||||
| 220 | 8 | 1800 | 13950 | |||||
| 218 | 8 | 1800 | 13950 | |||||
| 216 | 8 | 1800 | 13950 | |||||
| 214 | 8 | 1800 | 13950 | |||||
| 212 | 8 | 1800 | 13950 |
In our above payoff chart,
we see that we are at a loss if Bandhan Bank expires above the 277 level, and our maximum loss is RS 4050.
and our Profit starts if Bandhan bank falls below 277 level on expiry basis, our maximum profit Rs 13950 if Bandhan bank fall below 270 level.
Other Articles
Disclaimer :
Blog Provides Views and Opinion as Educational Purpose Only, We are not responsible for any of your Profit / Loss with this blog Suggestions. The owner of this blog is not SEBI registered, consult your Financial Advisor before taking any Position.