We are trying to create a Reliance option strategy first, we check all charts. monthly, weekly, daily intraday.
Reliance monthly chart
In our Monthly chart Reliance Shows us Buy Signal.
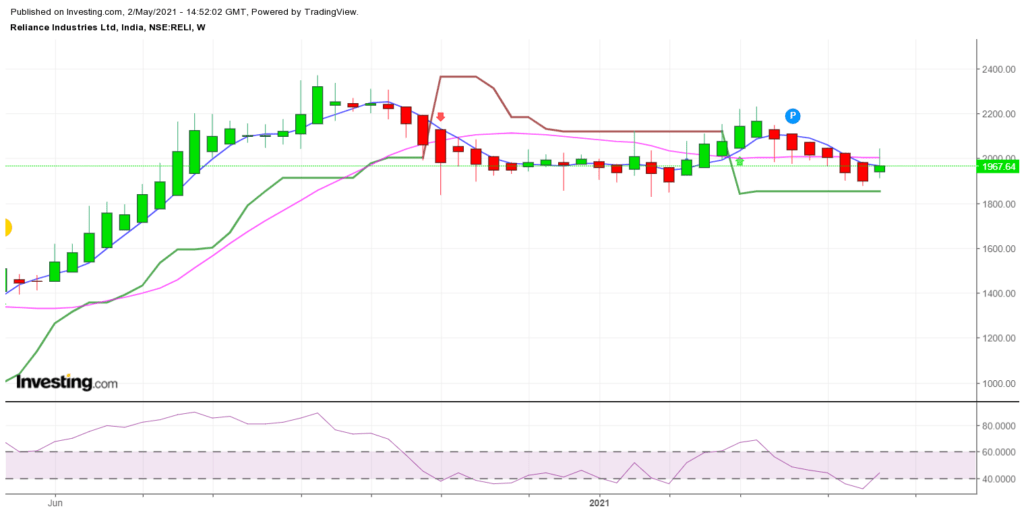
Reliance weekly chart
In our Weekly chart Reliance Shows us Buy Signal.
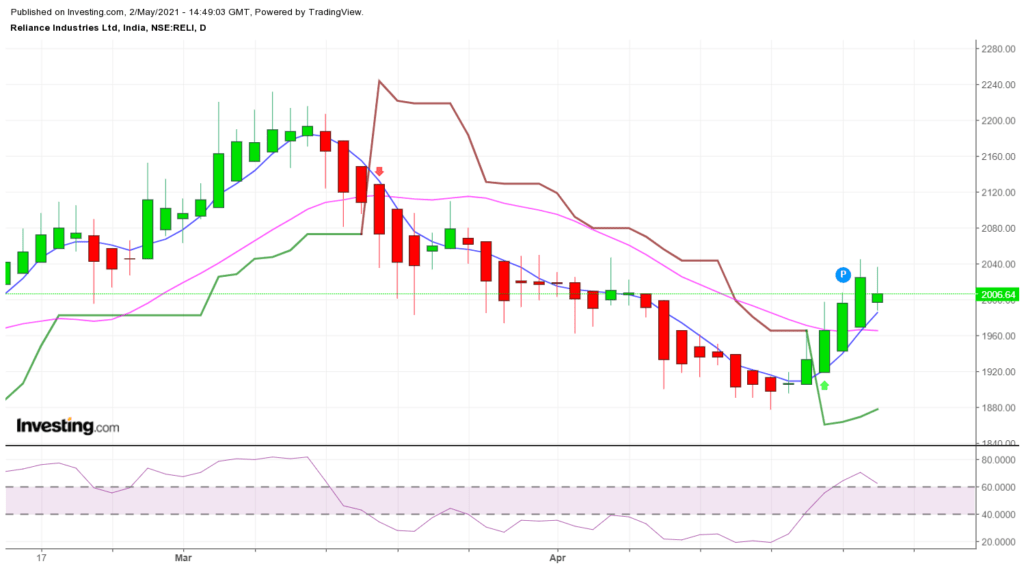
Reliance daily chart
In our Daily chart Reliance Shows us Buy Signal near 1942.
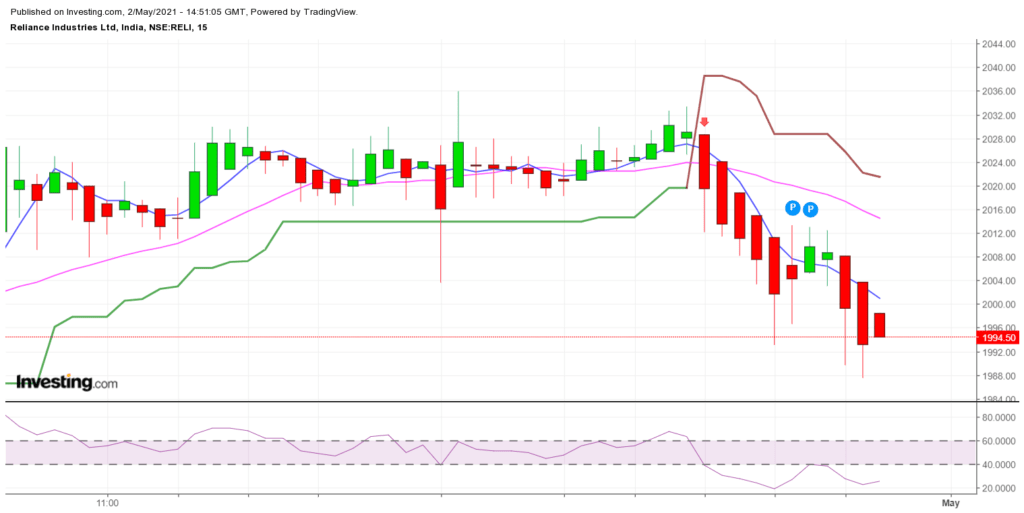
Reliance Intraday chart
In our Intraday chart Reliance shows us a short signal near 2024 and it will come down to 1994, no we got an opportunity with the base of our daily chart so we create a below-mentioned strategy.
Reliance Option Strategy
First we Buy Reliance Future @ 2005, Short 2000 Call option @ 81, Short 2100 Call option @ 40, Buy 1900 Put option @ 34.
Buy Reliance Future @ 2005,
Short 2000 Call option @ 81,
Short 2100 Call option @ 40,
Buy 1900 Put option @ 34.
Payoff chart of the Reliance strategy
No
Strike
Premium
Option
Buy(1)Sell(0)
Expiry
Gross P/L
LOT SIZE
TOTAL P /L
1
1
2004
future
1
2300
-118
250
-29500
2
2000
81
call
0
2290
-108
250
-27000
3
2100
40
call
0
2280
-98
250
-24500
4
1900
34
put
1
2270
-88
250
-22000
5
2260
-78
250
-19500
6
2250
-68
250
-17000
7
2240
-58
250
-14500
8
2230
-48
250
-12000
9
2220
-38
250
-9500
2210
-28
250
-7000
Difference
10
2200
-18
250
-4500
Expiry from
2300
2190
-8
250
-2000
lot size
250
2180
2
250
500
2170
12
250
3000
whatsapp
9699646408
2160
22
250
5500
2150
32
250
8000
2140
42
250
10500
2130
52
250
13000
2120
62
250
15500
2110
72
250
18000
2100
82
250
20500
2090
82
250
20500
2080
82
250
20500
2070
82
250
20500
2060
82
250
20500
2050
82
250
20500
2040
82
250
20500
2030
82
250
20500
2020
82
250
20500
2010
82
250
20500
2000
82
250
20500
1990
72
250
18000
1980
62
250
15500
1970
52
250
13000
1960
42
250
10500
1950
32
250
8000
1940
22
250
5500
1930
12
250
3000
1920
2
250
500
1910
-8
250
-2000
1900
-18
250
-4500
1890
-18
250
-4500
1880
-18
250
-4500
1870
-18
250
-4500
1860
-18
250
-4500
1850
-18
250
-4500
1840
-18
250
-4500
1830
-18
250
-4500
1820
-18
250
-4500
1810
-18
250
-4500
In the above charts
In the above payoff Chart, we see our maximum loss is unlimited on the upside. if Reliance expires above 2180, and below 1920 our loss is limited to RS 4500.
and our Maximum profit approx RS 20500 if Reliance expiry in between 2000 to 2100.
we are in profit if Reliance expiry is between 1920 to 2180.
Blog Provides Views and Opinion as Educational Purpose Only, We are not responsible for any of your Profit / Loss with this blog Suggestions. The owner of this blog is not SEBI registered, consult your Financial Advisor before taking any Position.