What is Bank Nifty? | Stocks Selection Criteria for Bank Nifty or Nifty Bank
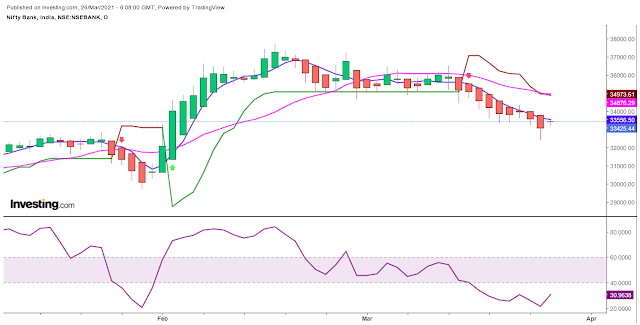
Bank Nifty Chart
What is Bank Nifty?
Bank Nifty Or Nifty Bank is an index that comprises or group of 12 stocks (that trade on the National stock exchange) from the banking industry These stocks are the most liquid and largely capitalized. It was launched in the year 2003 Nifty Bank investing methodology is a smart choice. The Nifty Bank share prices and values are displayed on a real-time basis during the trading hours. Sometimes it is also referred to as The Bank Nifty Index can be referred for multiple purposes.
For instance, the introduction of new ETFs, benchmarking of fund portfolios, index funds, and other structured products. What is Nifty Bank? Nifty Bank stocks belong to the private as well as the public sector. Though introduced in 2003, Nifty Bank Index uses Jan 2000 as the base year. This is because this weighted index offers a benchmark (for investors as well as market intermediaries) that gives a solid view of the banking sector’s capital market performance.
Nifty Bank lot size and Contract value.
In our future and options trading, a lot size refers to the number of stocks that you can purchase or sell in a single transaction. It is also referred to as the size of your trade. This concept helps to bring in standardization. The bank nifty or nifty bank lot size currently stands at 25.
the contract value of bank nifty is calculated current market price is multiple by lot size.
So today contract value is 34000*25=850000/-
Stocks Selection Criteria for Nifty Bank.
There are some criteria for the selection of banking stocks in the Nifty Bank index set up by the national stock exchange.
- Trading Frequency
In the last 6 months, the trading frequency of the chosen or preferred bank should be a minimum of 90%.
- Market Capitalization Rank
The chosen or preferred bank should have a market capitalization rank that should be less than 500 in the universe.
- Free-Float Capitalization
Final Selection of 12 chosen or preferred banks that will be included based on the free-float market capitalization method.
- Turnover Rank
The chosen or preferred bank should have a turnover rank should be less than 500 in the universe.
- Net Worth
The net worth of the chosen or preferred bank should be positive.
- Futures & Options Segment
A chosen or preferred bank will be included in the bank nifty or nifty bank index only if it is traded in F&O (Futures & Options Segment).
- Listing History
The chosen or preferred bank should have six months listing history in the national stock exchange except in the case where the bank is coming with an IPO, and then it should have three months listing history.
- Weightage
Each chosen or preferred banking stock will have its weights in the index. No single bank shall have more than 34% share.
Further, the weightage of the top three banks combined should not be more than 63% while re-balancing.
- Re-Balancing
Bank Nifty or Nifty Bank index is re-balanced on a half-yearly basis on 1st January and 1st July
List of shares in Bank Nifty with their weightage:
|
STOCKS |
WEIGHTAGE |
|
HDFC BANK |
26.06% |
|
ICICI BANK |
19.56% |
|
AXIS BANK |
15.93% |
|
SBI |
13.27% |
|
KOTAK BANK |
12.37% |
|
INDUSIND BANK |
5.35% |
|
BANDHAN BANK |
2.07% |
|
FEDERAL BANK |
1.48% |
|
IDFC BANK |
1.18% |
|
RBL BANK |
0.94% |
|
BANK BARODA |
0.91% |
|
PNB BANK |
0.87% |
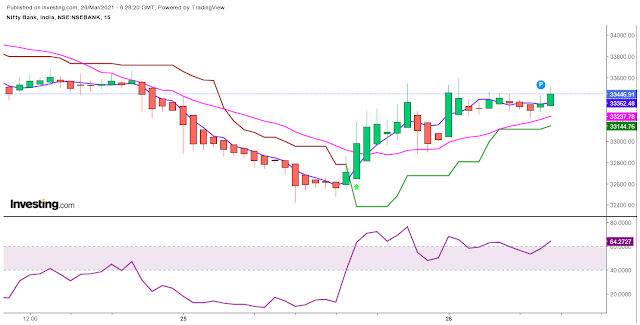
Intraday chart analysis
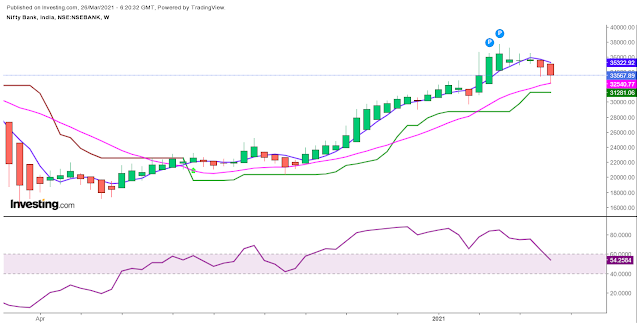
Weekly chart analysis
Monthly chart analysis
The Bank Nifty or Nifty bank Chart can be used to understand the price movement and any changes in trends in the Bank Nifty Index. The data is available for multiple time frames such as 5 min, 15 min, daily, weekly, monthly, Quarterly, etc. The daily, weekly, and monthly Nifty Bank charts are most commonly used to make entry or exit decisions.
Option Chain
Automated Option Chain Call Side Data
Automated Option Chain Put Side Data
Option Chain
An option chain lists all the option (call and put) strike prices along with the premium for a specific expiry period. You can check the Option chain along with the Nifty Bank spot prices on the hedging strategies portal.
Other articles you may like
Disclaimer :
Blog Provides Views and Opinion as Educational Purpose Only, We are not responsible for any of your Profit / Loss with this blog Suggestions. The owner of this blog is not SEBI registered, consult your Financial Advisor before taking any Position.


