ITC Option Strategy June 2021 | ITC Chart Analysis
ITC Option Strategy | ITC Chart Analysis
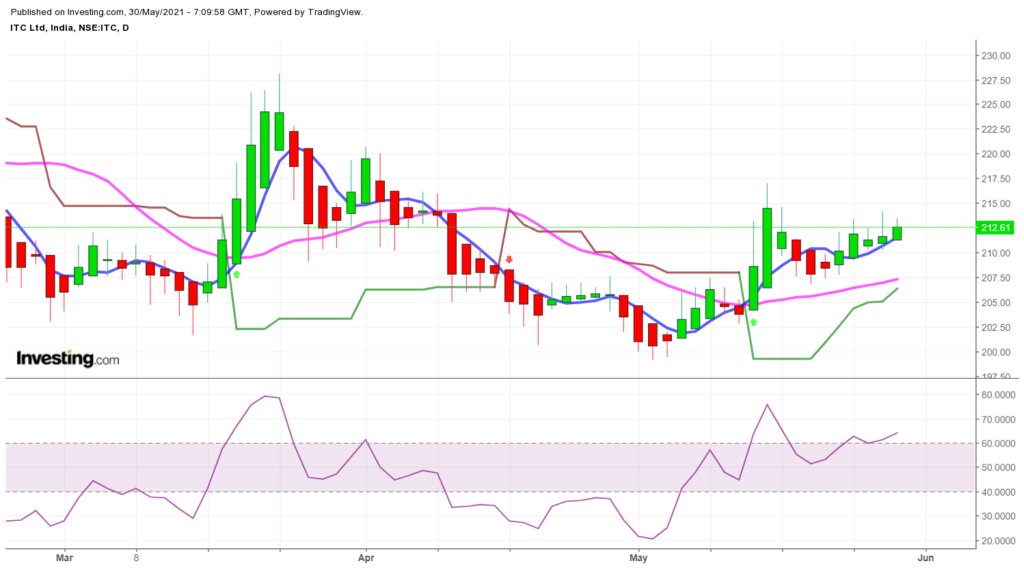
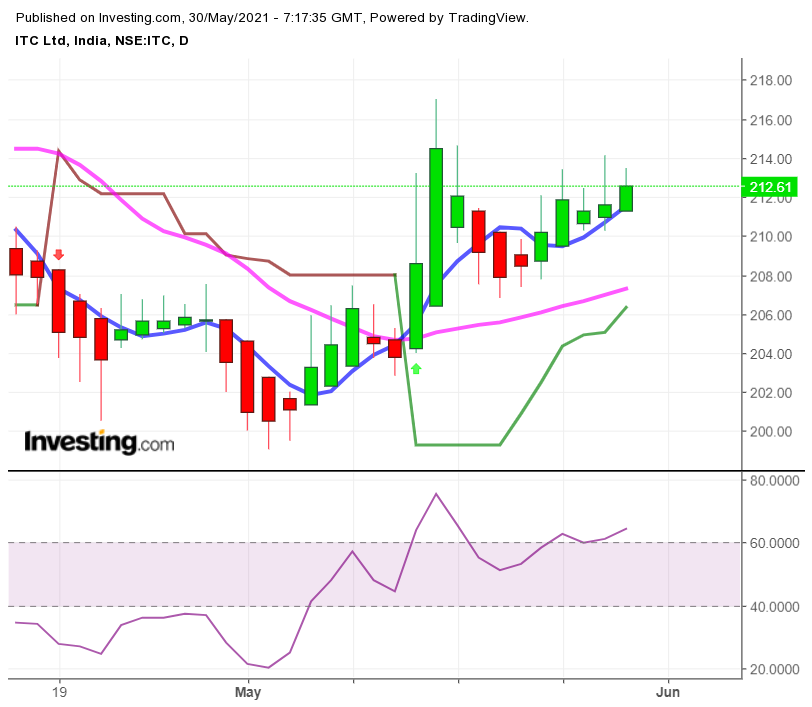
ITC Daily Chart


ITC Option Strategy
As we see in our chart that ITC generates buy signal near 207. and now our view Is that it can cross 220 easily in the coming days. so we are going to make a simple strategy,.
ITC Strategy
First we short 220 Put, Buy 210 Put and short 200 put.
Short 220 Put near 12.
Buy 210 Put near 5.85.
Short 200 Put near 2.
Payoff chart for the above ITC strategy
| No | Strike | Premium | Option | Buy(1)Sell(0) | Expiry | Gross P/L | LOT SIZE | TOTAL P /L |
| 1 | 220 | 12 | put | 0 | 225 | 8 | 3200 | 26080 |
| 2 | 210 | 5.85 | put | 1 | 224 | 8 | 3200 | 26080 |
| 3 | 200 | 2 | put | 0 | 223 | 8 | 3200 | 26080 |
| 4 | 222 | 8 | 3200 | 26080 | ||||
| 5 | 221 | 8 | 3200 | 26080 | ||||
| 6 | 220 | 8 | 3200 | 26080 | ||||
| 7 | 219 | 7 | 3200 | 22880 | ||||
| 8 | 218 | 6 | 3200 | 19680 | ||||
| 9 | 217 | 5 | 3200 | 16480 | ||||
| 216 | 4 | 3200 | 13280 | |||||
| Difference | 1 | 215 | 3 | 3200 | 10080 | |||
| Expiry from | 225 | 214 | 2 | 3200 | 6880 | |||
| lot size | 3200 | 213 | 1 | 3200 | 3680 | |||
| 212 | 0 | 3200 | 480 | |||||
| 211 | -1 | 3200 | -2720 | |||||
| 210 | -2 | 3200 | -5920 | |||||
| 209 | -2 | 3200 | -5920 | |||||
| 208 | -2 | 3200 | -5920 | |||||
| 207 | -2 | 3200 | -5920 | |||||
| 206 | -2 | 3200 | -5920 | |||||
| 205 | -2 | 3200 | -5920 | |||||
| 204 | -2 | 3200 | -5920 | |||||
| 203 | -2 | 3200 | -5920 | |||||
| 202 | -2 | 3200 | -5920 | |||||
| 201 | -2 | 3200 | -5920 | |||||
| 200 | -2 | 3200 | -5920 | |||||
| 199 | -3 | 3200 | -9120 | |||||
| 198 | -4 | 3200 | -12320 | |||||
| 197 | -5 | 3200 | -15520 | |||||
| 196 | -6 | 3200 | -18720 | |||||
| 195 | -7 | 3200 | -21920 | |||||
| 194 | -8 | 3200 | -25120 | |||||
| 193 | -9 | 3200 | -28320 | |||||
| 192 | -10 | 3200 | -31520 | |||||
| 191 | -11 | 3200 | -34720 | |||||
| 190 | -12 | 3200 | -37920 | |||||
| 189 | -13 | 3200 | -41120 | |||||
| 188 | -14 | 3200 | -44320 | |||||
| 187 | -15 | 3200 | -47520 | |||||
| 186 | -16 | 3200 | -50720 | |||||
| 185 | -17 | 3200 | -53920 | |||||
| 184 | -18 | 3200 | -57120 | |||||
| 183 | -19 | 3200 | -60320 | |||||
| 182 | -20 | 3200 | -63520 | |||||
| 181 | -21 | 3200 | -66720 | |||||
| 180 | -22 | 3200 | -69920 | |||||
| 179 | -23 | 3200 | -73120 | |||||
| 178 | -24 | 3200 | -76320 | |||||
| 177 | -25 | 3200 | -79520 | |||||
| 176 | -26 | 3200 | -82720 |
Above chart
As we see in the above Chart that our loss starts if ITC expire below 211 and our Maximum loss is unlimited on the downside.
and our Maximum Profit is near Rs 26000 if ITC expire above 220.
and above 212 we are profit.
Others articles
- Free Mock NISM currency derivative Test-1
- Dow chart analysis
- Best option strategy
- Bank nifty automated option chain (monthly)
- Nifty automated option chain (monthly)
- TCS automated option chain
- Risk Reward 1:14 Click Here>>>
- Free Mock test NISM derivative Series 8 Test -2
- Free Mock test NISM derivative series 8 Test-1
Disclaimer :
Blog Provides Views and Opinion as Educational Purpose Only, We are not responsible for any of your Profit / Loss with this blog Suggestions. The owner of this blog is not SEBI registered, consult your Financial Advisor before taking any Position.
