Maruti chart analysis | Maruti option startegy | Maruti Hedging
Maruti chart analysis
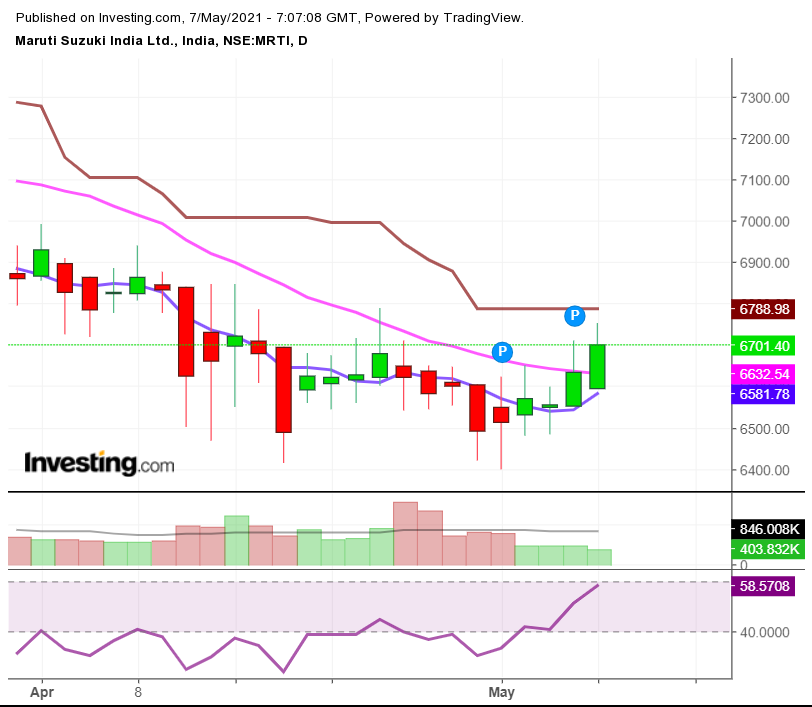
Daily chart Maruti

Maruti chart analysis,
In our daily chart, we see that Maruti is in the range of 6400 to 7000 from last some days, so we create a range-bound strategy for some profit.
Maruti option strategy
Maruti option strategy,
First, we Buy future, buy 65000 calls, short 6800 calls and buy 7000 calls.
buy future @ 6713
Buy 6500 calls @ 307
Short 6800 Call @ 152
Buy 7000 calls @ 85
Payoff chart of Maruti strategy
| No | Strike | Premium | Option | Buy(1)Sell(0) | Expiry | Gross P/L | LOT SIZE | TOTAL P /L |
| 1 | 1 | 6712 | future | 1 | 7300 | -39 | 100 | -3900 |
| 2 | 6500 | 307 | call | 0 | 7250 | -39 | 100 | -3900 |
| 3 | 6800 | 152 | call | 0 | 7200 | -39 | 100 | -3900 |
| 4 | 7000 | 85 | call | 1 | 7150 | -39 | 100 | -3900 |
| 5 | 7100 | -39 | 100 | -3900 | ||||
| 6 | 7050 | -39 | 100 | -3900 | ||||
| 7 | 7000 | -39 | 100 | -3900 | ||||
| 8 | 6950 | 11 | 100 | 1100 | ||||
| 9 | 6900 | 61 | 100 | 6100 | ||||
| 6850 | 111 | 100 | 11100 | |||||
| Difference | 50 | 6800 | 161 | 100 | 16100 | |||
| Expiry from | 7300 | 6750 | 161 | 100 | 16100 | |||
| lot size | 100 | 6700 | 161 | 100 | 16100 | |||
| 6650 | 161 | 100 | 16100 | |||||
| 6600 | 161 | 100 | 16100 | |||||
| 6550 | 161 | 100 | 16100 | |||||
| 6500 | 161 | 100 | 16100 | |||||
| 6450 | 111 | 100 | 11100 | |||||
| 6400 | 61 | 100 | 6100 | |||||
| 6350 | 11 | 100 | 1100 | |||||
| 6300 | -39 | 100 | -3900 | |||||
| 6250 | -89 | 100 | -8900 | |||||
| 6200 | -139 | 100 | -13900 | |||||
| 6150 | -189 | 100 | -18900 | |||||
| 6100 | -239 | 100 | -23900 | |||||
| 6050 | -289 | 100 | -28900 | |||||
| 6000 | -339 | 100 | -33900 | |||||
| 5950 | -389 | 100 | -38900 | |||||
| 5900 | -439 | 100 | -43900 | |||||
| 5850 | -489 | 100 | -48900 | |||||
| 5800 | -539 | 100 | -53900 | |||||
| 5750 | -589 | 100 | -58900 | |||||
| 5700 | -639 | 100 | -63900 | |||||
| 5650 | -689 | 100 | -68900 | |||||
| 5600 | -739 | 100 | -73900 | |||||
| 5550 | -789 | 100 | -78900 | |||||
| 5500 | -839 | 100 | -83900 | |||||
| 5450 | -889 | 100 | -88900 | |||||
| 5400 | -939 | 100 | -93900 | |||||
| 5350 | -989 | 100 | -98900 | |||||
| 5300 | -1039 | 100 | -103900 | |||||
| 5250 | -1089 | 100 | -108900 | |||||
| 5200 | -1139 | 100 | -113900 | |||||
| 5150 | -1189 | 100 | -118900 | |||||
| 5100 | -1239 | 100 | -123900 | |||||
| 5050 | -1289 | 100 | -128900 | |||||
| 5000 | -1339 | 100 | -133900 | |||||
| 4950 | -1389 | 100 | -138900 | |||||
| 4900 | -1439 | 100 | -143900 | |||||
| 4850 | -1489 | 100 | -148900 |
Above payoff chart
In our above payoff chart,
We see that our loss is limited on the upside if Maruti expires above 6961. and maximum loss is RS 3900 on the upside.
And loss starts if Maruti falls below 6340. and there is unlimited loss on the downside.
and our profit range is 6340 to 6960 and maximum profit is RS 16100.
For better understanding pls see the video
Other articles
Disclaimer :
Blog Provides Views and Opinion as Educational Purpose Only, We are not responsible for any of your Profit / Loss with this blog Suggestions. The owner of this blog is not SEBI registered, consult your Financial Advisor before taking any Position.
